spotify <- read_csv('https://bcdanl.github.io/data/spotify_all.csv')Let’s analyze the spotify data:
rmarkdown::paged_table(spotify) 🎹
Variables for spotify data.frame
The following are the variables present in the spotify data.frame.
-‘pid’ -‘playlist_name’ -‘pos’ -‘artist_name’ -‘track_name’ -‘duration_ms’ -‘album_name’
Figure 1
Provide a ggplot barchart of the top 10 spotify artists.
top_artists <- spotify %>%
  group_by(artist_name) %>%
  summarise(total_playlists = n_distinct(pid)) %>%
  top_n(10, total_playlists)

ggplot(top_artists, aes(x = reorder(artist_name, -total_playlists), y = total_playlists)) +
  geom_bar(stat = "identity", fill = "coral") +
  labs(title = "Top 10 Artists in Playlists",
       x = "Artist Name",
       y = "Number of Playlists") +
  theme_minimal() +
  theme(axis.text.x = element_text(angle = 45, hjust = 1))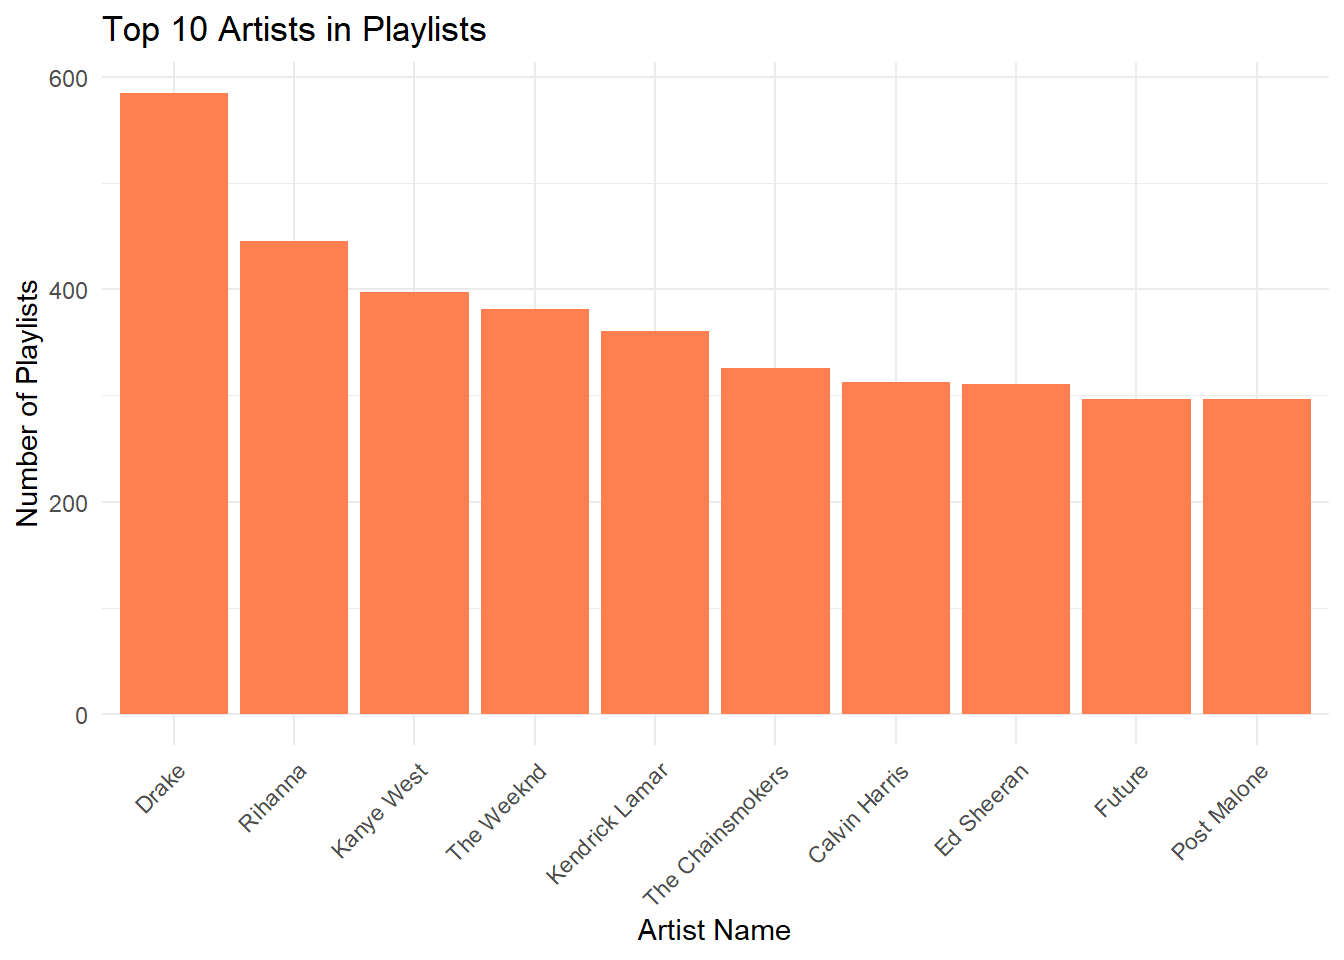
Figure 2
Create both (1) a ggplot and (2) a simple comment to describe the distribution of ‘pos’ in playlists 🎸
library(ggplot2)

ggplot(spotify, aes(x = pos)) +
  geom_histogram(binwidth = 1, fill = "skyblue", color = "black") +
  labs(title = "Distribution of Position in Playlists",
       x = "Position",
       y = "Frequency") +
  theme_minimal()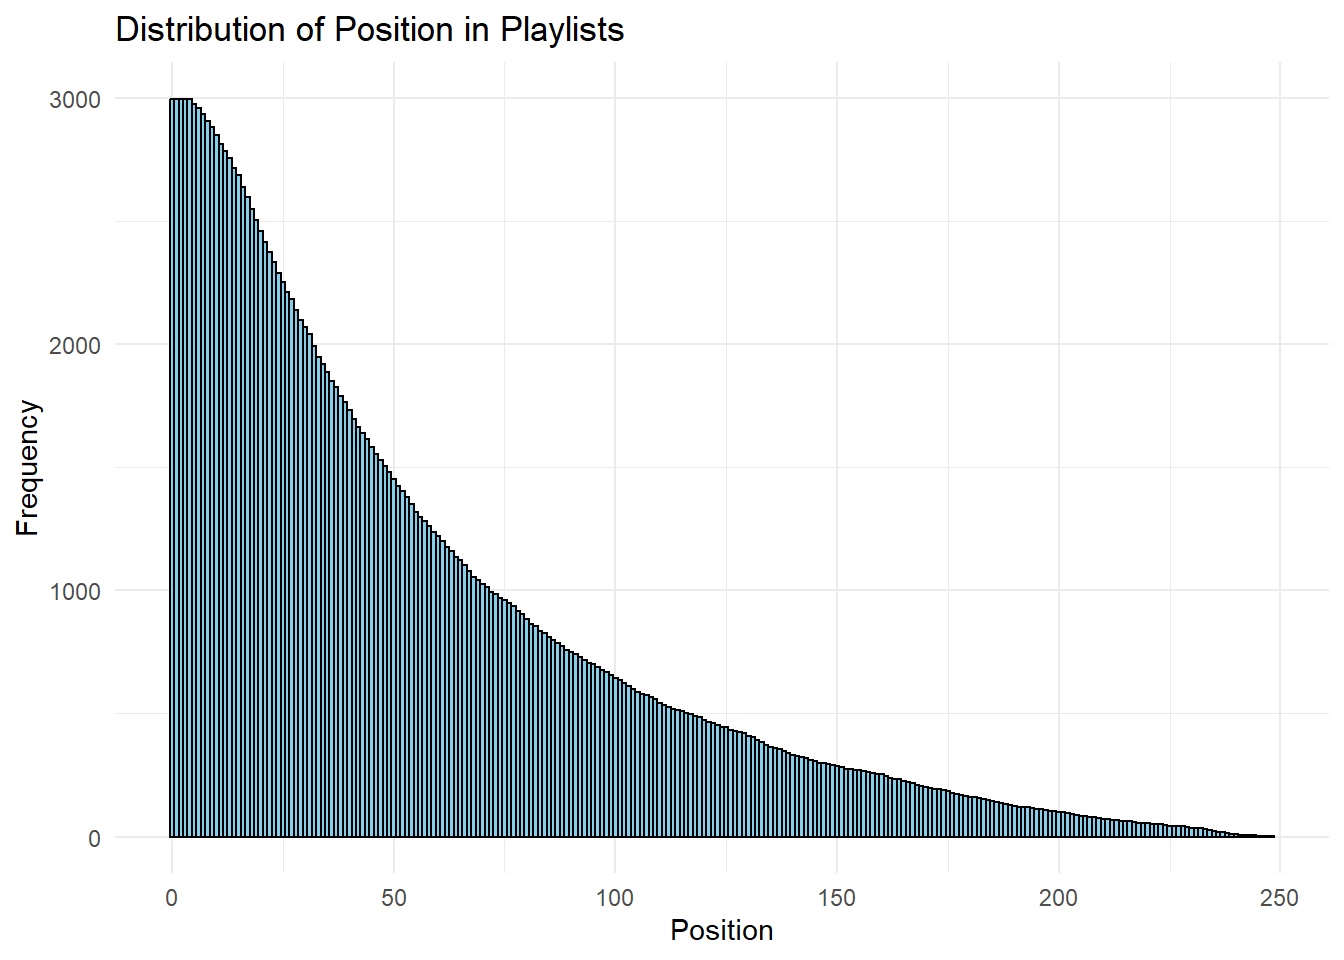
The above figure shows us that the ones postion increases with a decrease in frequency, and vice versa, on spotify.
Figure 3
Provide both (1) a scatter plot (2) that shows the relationship between the ‘pos’ and the ‘duration_ms’ of the track 🎧
library(ggplot2)

set.seed(123)
random_subset <- spotify[sample(nrow(spotify), 500), ]

ggplot(random_subset, aes(x = pos, y = duration_ms)) +
  geom_point(color = "orange", alpha = 0.7) +
  labs(title = "Scatter Plot of Position vs. Track Duration",
       x = "Position in Playlist",
       y = "Duration (ms)") +
  theme_minimal()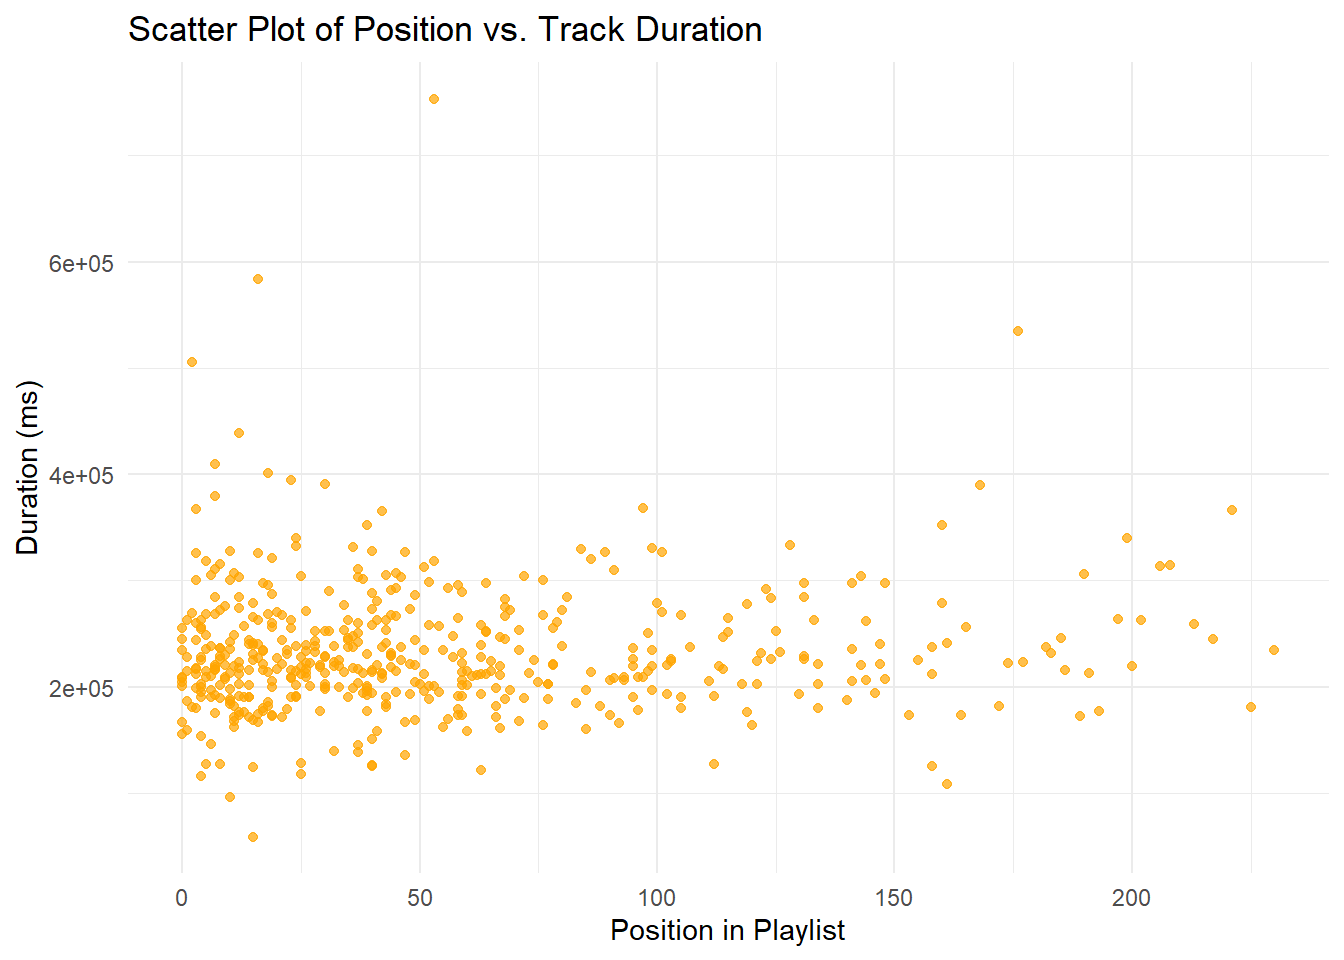
In this example, I created a ggplot function to create a scatter plot, mapping the x-axis to the position in the playlist (pos) and the y-axis to the duration of the track (duration_ms). By using a random subset of 500 points for better visualization, it was found that most songs fall along a similar duration regardless of their position in the playlist.